


Introduction
Technical analysis (TA) is a key component in trading, whether you’re investing in stocks, cryptocurrencies, or other assets. One of the most widely used tools in TA is the moving average (MA), which helps traders identify trends and smooth out price fluctuations on charts.
Though there are countless TA indicators, moving averages stand out for their simplicity and usefulness. They help cut through the market noise and highlight potential direction by averaging historical data.
Types of Moving Averages
There are two major types of moving averages used by traders:
1. Simple Moving Average (SMA)
SMA calculates the average price of an asset over a specified number of periods. For example, a 10-day SMA adds the last 10 closing prices and divides by 10. When a new day is added, the oldest is dropped—keeping the average current.
All price points are weighted equally, which some traders view as a limitation since newer data might be more relevant in fast-moving markets.
2. Exponential Moving Average (EMA)
EMA is similar to SMA but gives more weight to the most recent data. This makes the EMA more responsive to recent price changes, making it popular among short-term traders.
While both SMA and EMA have their use cases, EMA is typically used in faster-paced trading due to its sensitivity to new price action.
How to Use Moving Averages
MAs are “lagging” indicators, meaning they reflect past price action rather than predict future movement. The longer the period used, the slower the MA reacts to price changes.
For example:
-
50-day, 100-day, and 200-day MAs are popular among long-term investors.
-
Shorter time frames (e.g., 10-day, 20-day) are favored by day and swing traders.
In crypto, which trades 24/7, MA settings can be adjusted to reflect round-the-clock volatility.
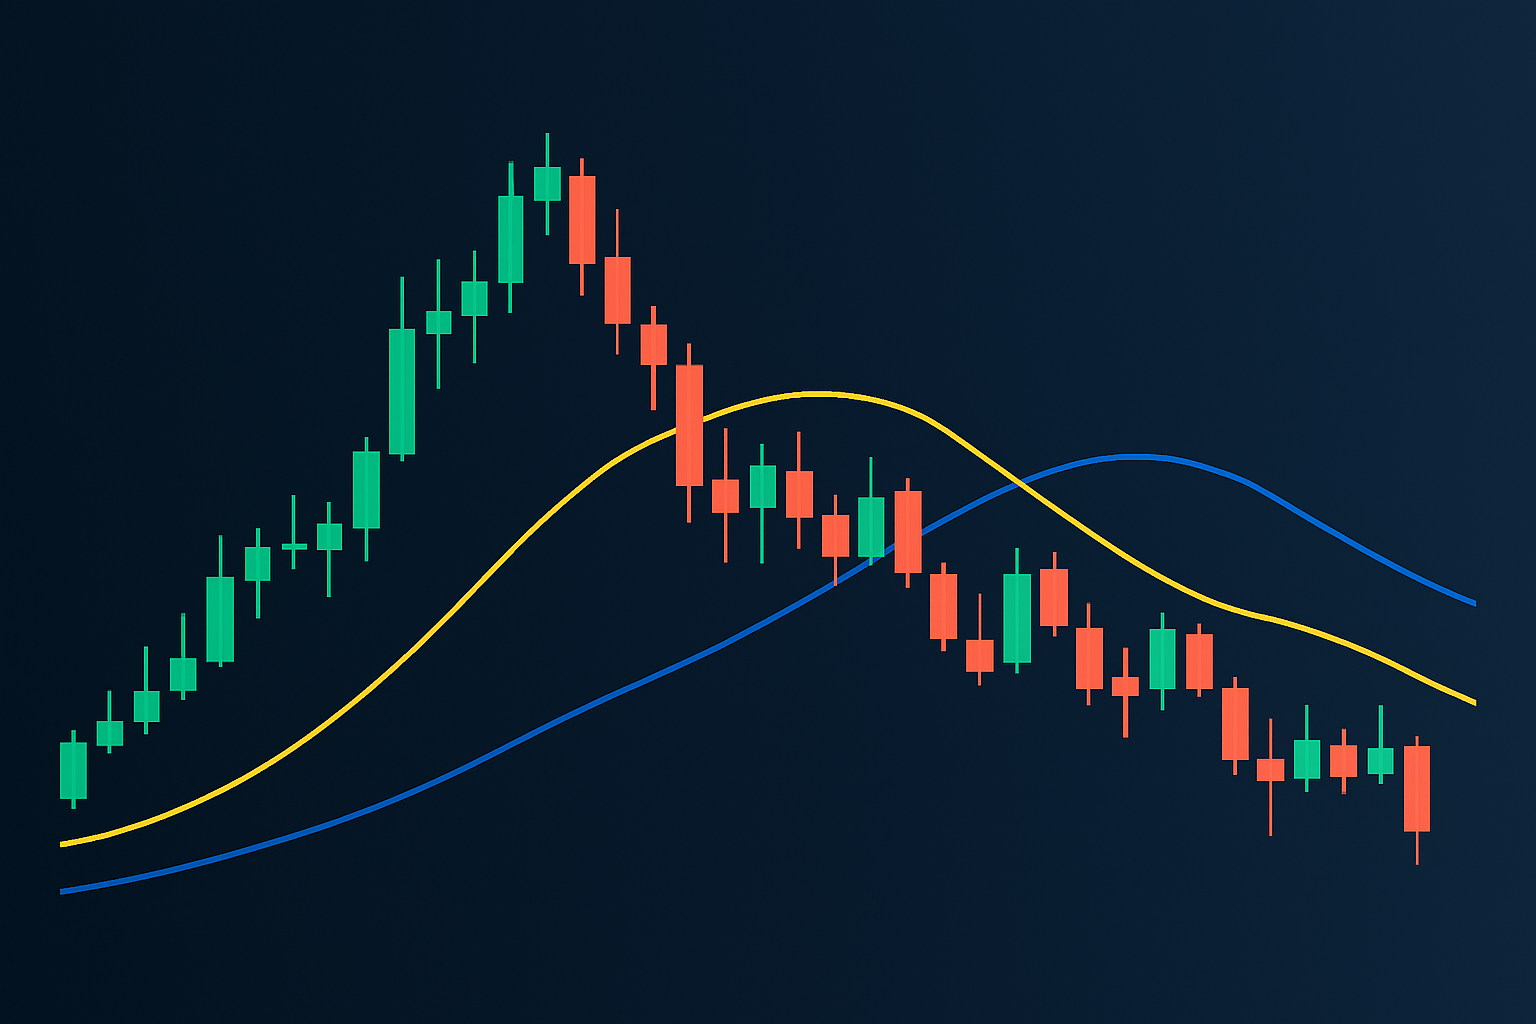
Crossover Signals
MAs are often used in pairs to generate bullish and bearish signals through crossovers:
-
Golden Cross: Short-term MA crosses above long-term MA → bullish trend.
-
Death Cross: Short-term MA crosses below long-term MA → bearish trend.
These crossovers are widely watched and often indicate potential entry or exit points.
Time Frames and Strategy
Time frames can vary based on trading goals:
-
Intraday traders may use MAs based on minutes or hours.
-
Swing or position traders prefer days or weeks.
The key is consistency. Match your time frame to your strategy and risk tolerance.
Limitations of Moving Averages
Despite their usefulness, MAs aren’t flawless:
-
Lagging indicator: By the time an MA crossover occurs, price may have already moved.
-
False signals: Sudden price spikes can trigger fake signals, known as “bull traps.”
Because of this, moving averages are best used alongside other tools like volume indicators, RSI, or MACD.
Closing Thoughts
Moving averages are foundational tools in any trader’s toolkit. They offer visual clarity on trends and help smooth out volatility.
However, no indicator is perfect. Combine MAs with other signals and use sound risk management practices to avoid falling into traps.
Whether you’re using SMA or EMA, mastering moving averages can elevate your trading game.