Bitcoin Bitcoin $ 113,517.00 2.22% | Ethereum Ethereum $ 2,821.94 2.79% | XRP XRP $ 2.51 4.87% | BNB BNB $ 676.57 1.20% | Solana Solana $ 159.83 2.56% | Dogecoin Dogecoin $ 0.19 6.34% | TRON TRON $ 0.29 0.47% | Cardano Cardano $ 0.65 6.09% | Hyperliquid Hyperliquid $ 42.82 5.99% | Sui Sui $ 3.42 13.46% | Bitcoin Cash Bitcoin Cash $ 511.11 0.44% | Chainlink Chainlink $ 14.71 4.01% | Stellar Stellar $ 0.30 4.37% | Avalanche Avalanche $ 19.88 4.28% | LEO Token LEO Token $ 9.06 1.60% | Hedera Hedera $ 0.18 6.93% | Toncoin Toncoin $ 2.90 2.50% | Litecoin Litecoin $ 93.06 3.51% | WhiteBIT Coin WhiteBIT Coin $ 46.62 0.12% | Binance Bridged USDT (BNB Smart Chain) Binance Bridged USDT (BNB Smart Chain) $ 1.00 0.02% | Monero Monero $ 324.53 0.93% | Coinbase Wrapped BTC Coinbase Wrapped BTC $ 113,402.00 2.08% | Polkadot Polkadot $ 3.72 3.43% | Bitget Token Bitget Token $ 4.49 2.51% | Uniswap Uniswap $ 8.26 0.77% | Aave Aave $ 306.17 3.12% | Pi Network Pi Network $ 0.49 4.70% | Bittensor Bittensor $ 364.43 7.53% | Ethena Staked USDe Ethena Staked USDe $ 1.18 0.12% | Aptos Aptos $ 4.71 2.59% | NEAR Protocol NEAR Protocol $ 2.43 4.87% | Cronos Cronos $ 0.10 0.84% | OKB OKB $ 48.60 0.53% |
  • Home  
  • Bitcoin Hits Record Weekly Close at $109,200 — What It Means
- Market Insights & News - Trending News

Bitcoin Hits Record Weekly Close at $109,200 — What It Means

Bitcoin just closed the week at an all-time high of $109,200. Discover what’s driving this surge, the key resistance levels ahead, and what traders should expect next.

Bitcoin weekly candlestick chart showing historic close at $109,200

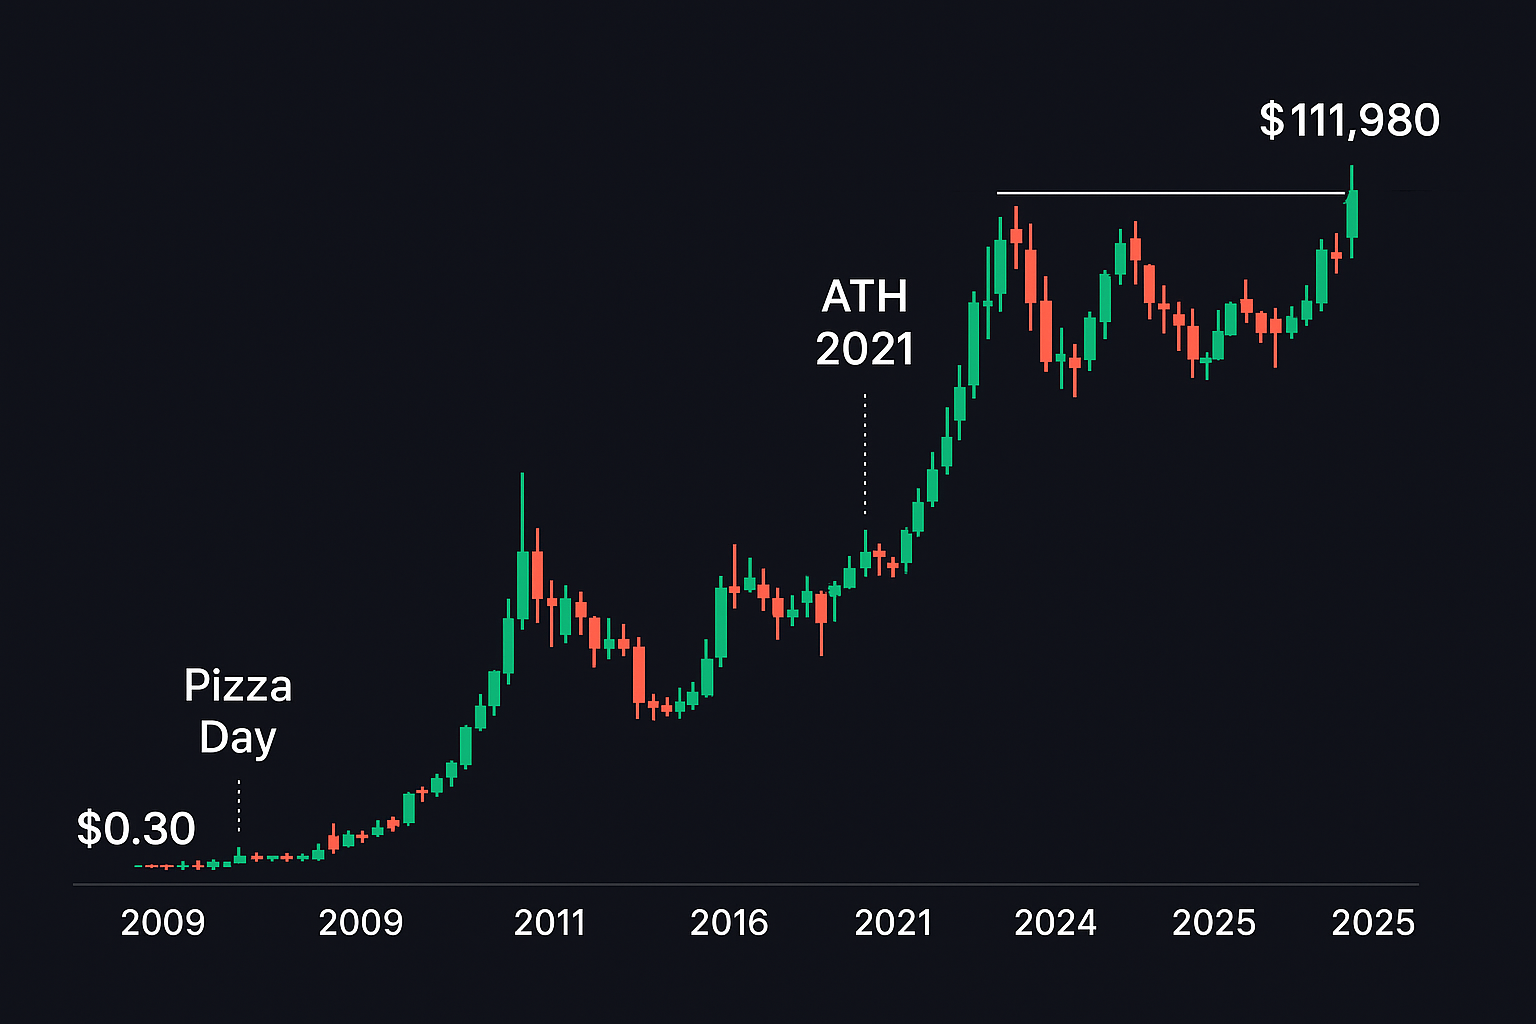
Historic BTC Weekly Close at $109,200

Bitcoin just closed the weekly candle at $109,200, marking its highest-ever weekly close — a clear signal that the bull market remains strong.

This milestone reflects significant institutional investment, strong liquidity, and growing retail confidence.

Drivers Behind the Surge

 1. Institutional Buying

Data shows big players entering through spot Bitcoin ETFs and large funds, contributing to the price rise.

 2. Liquidity and Market Support

Trading volume and liquidity have increased, reinforcing key support between $103K–$105.5k and resistance around $110K–$112k.

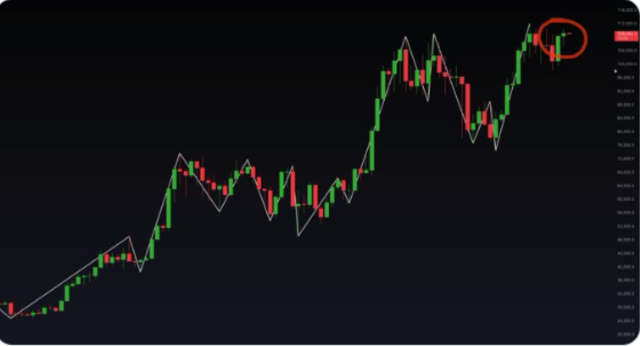
3. Technical Breakout

Analyses from Coinopedia and TradingView confirm that the weekly close above major resistance is a bullish breakout that paves the way for price discovery.

What to Expect Next

  • A clean breakout above $112K may kickstart the next leg upward.

  • If BTC forms a bearish reversal candle near current levels, a pullback towards $100K is possible.

  • Analysts expect resistance zones and potential targets in the $120K–$140K range if momentum holds.

Why This Matters for You

  • Confirmation of bull trend: A record weekly close is a strong technical signal attracting more buyers.

  • Plan your entry points: Monitor price action around $112K for potential breakouts or pullbacks.

  • Stay ahead of volatility: Major weekly closes often precede sharp moves up or down.

Final Takeaway

With Bitcoin closing the weekly candle at $109,200, it’s entering uncharted territory. Watch how it behaves around the $112K zone — it could define the next major move into historic highs or set up a correction back to support.

Related Reads

Leave a comment

Your email address will not be published. Required fields are marked *

About Us

Acrob Crypto is your go-to platform for crypto news, blockchain education, and AI-driven market insights. We simplify cryptocurrency, trading, and DeFi, providing expert analysis, tutorials, and real-time updates.

Email Us: info@acrobcrypto.com

Acrob Crypto  @2025. All Rights Reserved.