


Key Takeaways
-
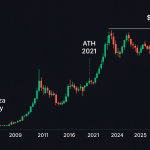
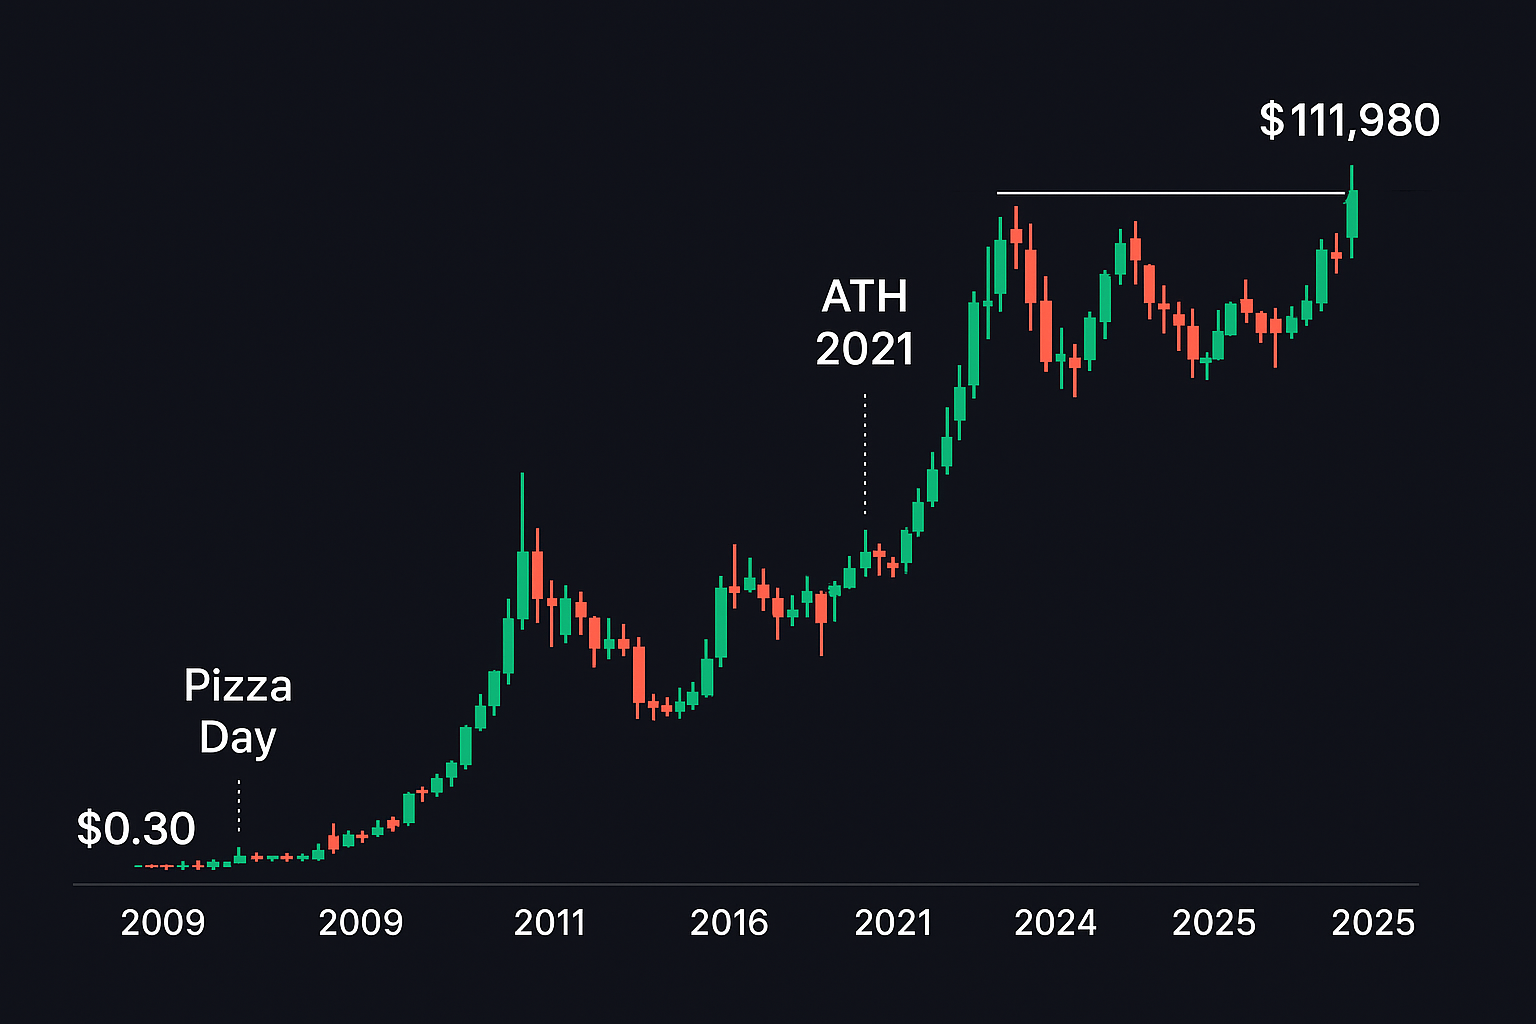
Bitcoin rose from $0.30 in 2011 to an all-time high of $111,980 in 2025, marking a 37,000,000%+ increase.
-
From the 2020 low of $3,880 to the 2025 high, BTC surged by more than 2,700%.
-
Bitcoin had an annualized return of ~142% from 2011 to 2025.
-
As of June 2025, BTC’s market cap is ~$2.18 trillion with a 64% dominance.
Introduction
Since 2009, Bitcoin (BTC) has experienced a dramatic rise in value, volatility, and mainstream adoption. While the path hasn’t been smooth, its growth has outperformed all traditional asset classes.
This guide reviews Bitcoin’s price journey, the events that shaped it, and key models used to analyze its trends.
How to Analyze Bitcoin’s Price History
There are three main approaches to analyzing BTC’s price:
1. Technical Analysis (TA)
Uses historical price and volume data to identify trends. Common tools include moving averages and candlestick patterns.
2. Fundamental Analysis (FA)
Looks at intrinsic value through metrics like active users, network activity, and transaction volumes.
3. Sentiment Analysis (SA)
Gauges market mood through news, social media, search trends, and investor behavior.
Early Bitcoin Trading (2009–2012)
-
Bitcoin launched in 2009, and early trades were made peer-to-peer.
-
May 22, 2010: First real-world purchase (2 pizzas for 10,000 BTC).
-
BTC reached $0.30 in 2011 and began gaining traction.
-
Early exchange hacks caused volatility due to limited liquidity.
What Influences Bitcoin’s Price?
Supply and Demand
-
21M coin limit and halving events reduce supply.
-
Demand is driven by adoption, institutional investment, and scarcity.
Regulation
-
Policy changes affect price through FOMO or fear.
-
Both restrictive and favorable regulations influence investor behavior.
Macroeconomic Factors
-
Inflation, interest rates, and global economic conditions shape BTC’s role as a hedge or risk asset.
Mining Costs
-
Higher electricity costs and reduced rewards post-halving increase break-even price levels for miners.
Bitcoin’s Price Journey: 2009 to 2025
Year Price Highlights
- 2011 BTC hits $0.30
- 2013 Crosses $1,000 for the first time
- 2017 Peaks near $20,000
- 2020 Drops to $3,880 in March COVID crash
- 2021 Reaches $69,000 ATH
- 2025 Hits $111,980 ATH
Growth from 2020 to 2025: Over 2,700%
Annualized Return (2011–2025): ~142%
Market Cap (2025): ~$2.18 trillion
Market Dominance: ~64%
Bitcoin vs. Traditional Assets (2016–2025)
| Year | Bitcoin | Gold | NASDAQ 100 |
|---|---|---|---|
| 2016 | 125% | 8% | 7.1% |
| 2017 | 1331% | 12.8% | 32.7% |
| 2018 | -73% | -1.9% | -0.1% |
| 2019 | 95% | 17.9% | 39% |
| 2020 | 301% | 24.8% | 48.6% |
| 2021 | 66% | -4.2% | 27.4% |
| 2022 | -65% | -0.8% | -32.6% |
| 2023 | 156% | 12.7% | 54.9% |
| 2024 | 121% | 26.7% | 25.6% |
| 2025 | 11.8% | 26% | 3.8% |
Source: Charlie Bilello
Long-Term Analysis Models
Stock-to-Flow (S2F)
-
Compares total BTC in circulation vs. new issuance.
-
Suggests higher prices as BTC becomes scarcer.
-
Used by many analysts to predict BTC’s future price.
Metcalfe’s Law
-
Network value = square of number of users.
-
More BTC users → exponentially more valuable network.
-
Charts show Metcalfe value often aligns with BTC price.
Closing Thoughts
Bitcoin’s price history reflects a powerful story of growth, volatility, and adoption. Whether through S2F, Metcalfe’s Law, or simple supply and demand, the data consistently points to BTC’s rising significance.
While no model can predict the future with certainty, Bitcoin’s track record of innovation and performance makes it a crucial part of the modern financial conversation.