


Introduction
In the world of trading and investing, technical analysis (TA) tools can help identify price trends and future movements. Whether you’re analyzing cryptocurrencies, forex, or stocks, Fibonacci retracement is one of the most popular tools used by traders to find key levels on charts.
It is based on the Fibonacci sequence, a mathematical concept discovered more than 700 years ago that continues to influence art, nature, and market behavior today.
What is Fibonacci Retracement?
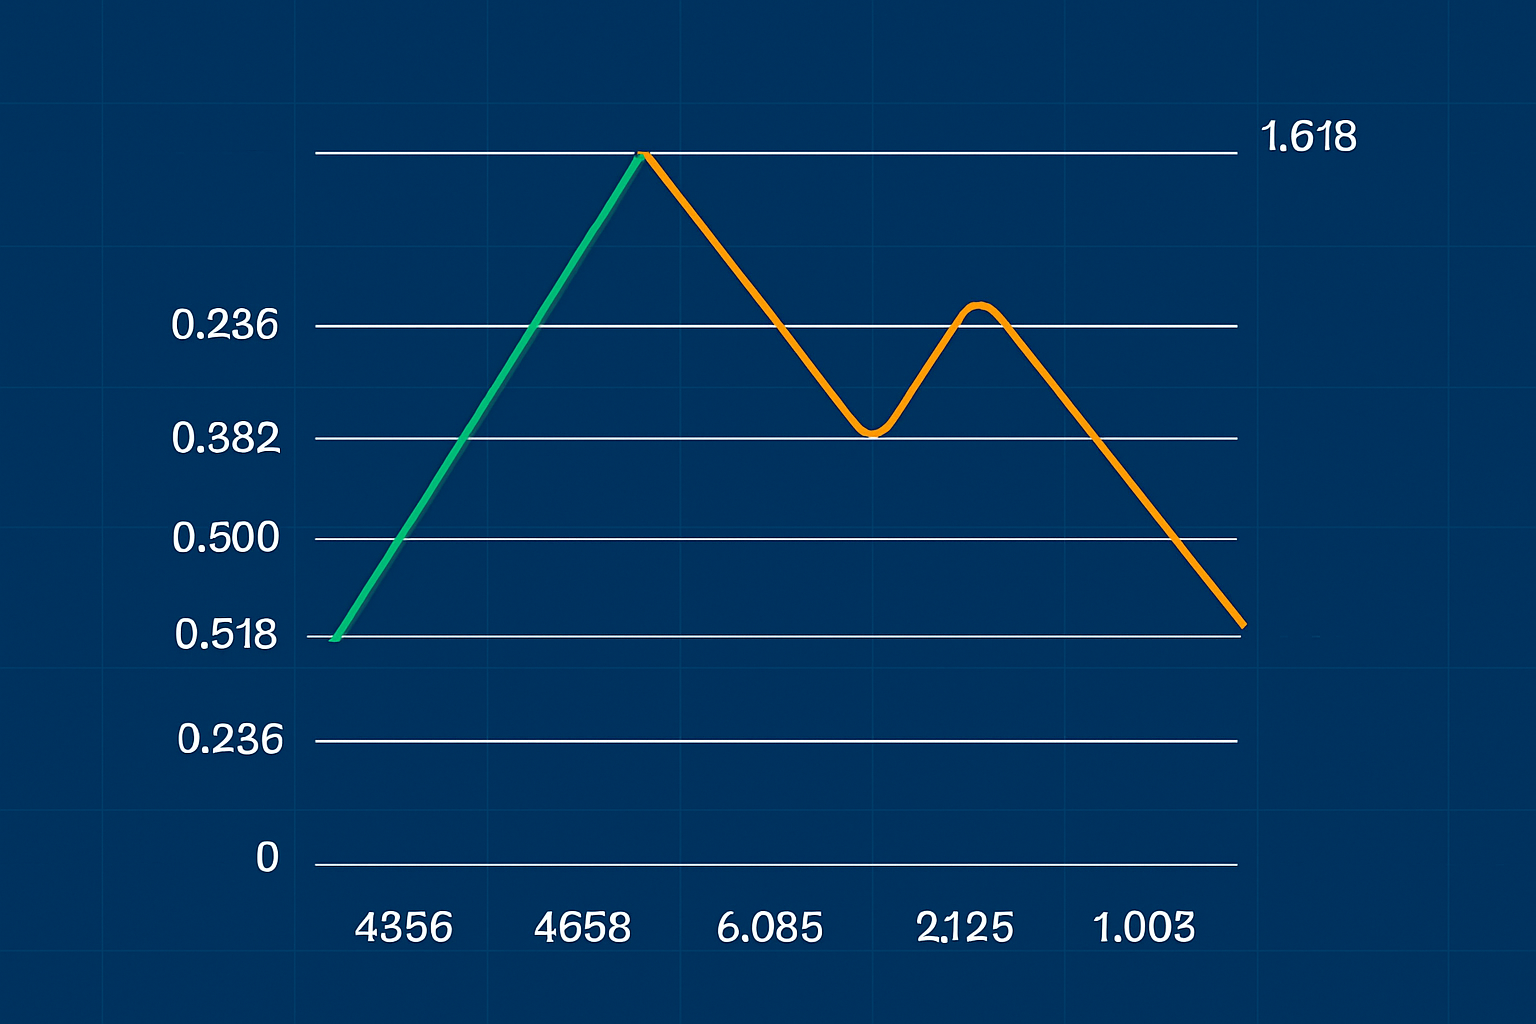
Fibonacci retracement is a TA tool used to identify potential levels of support and resistance. The tool plots horizontal lines based on the Fibonacci ratios:
-
0%
-
23.6%
-
38.2%
-
50% (commonly used, though not a Fibonacci ratio)
-
61.8%
-
78.6%
-
100%
Traders also use extended levels beyond 100%, such as 161.8%, 261.8%, and 423.6%, for forecasting future price targets.
These levels help traders determine where a market might pull back to before continuing in the original direction.
How Fibonacci Retracement Is Calculated
You don’t need to calculate the levels manually, as trading tools automatically generate them. However, the math behind the tool is rooted in the Fibonacci sequence:
0, 1, 1, 2, 3, 5, 8, 13, 21, 34, ...
Dividing a number by the next one in the sequence gives ~0.618, while dividing it by the number two places ahead gives ~0.382. These ratios form the basis of the retracement levels.
The Golden Ratio in Trading
The Golden Ratio (0.618 or 61.8%) is found in nature, art, architecture, and financial markets. This recurring pattern suggests that price action may behave in predictable ways, especially during pullbacks in trending markets.
How to Use Fibonacci Retracement in Trading
To apply the Fib tool:
-
Identify a significant high and low on a chart.
-
Draw the retracement tool from the low to high in an uptrend, or high to low in a downtrend.
The horizontal lines reveal potential support and resistance zones where the price may pause, reverse, or break through.
In an uptrend:
-
Start from swing low (100%) to swing high (0%)
-
Watch for support at 38.2%, 50%, or 61.8%
In a downtrend:
-
Start from swing high (100%) to swing low (0%)
-
Watch for resistance at the same levels
How Traders Use Fibonacci Levels
Fibonacci levels can help:
-
Set entry points
-
Determine take-profit zones
-
Set stop-loss levels
Traders may also combine Fibonacci retracement with:
-
Elliott Wave Theory
-
Candlestick patterns
-
Support and resistance zones
Example strategy: Buy at 38.2% retracement, sell at 23.6% during a pullback in an uptrend.
What Are Fibonacci Extensions?
Fibonacci extensions are used to project price targets beyond the current range. Once a retracement is complete, traders look at extension levels such as:
-
138.6%
-
161.8%
-
261.8%
-
423.6%
These act as potential future resistance (in uptrends) or support (in downtrends).
Limitations of Fibonacci Retracement
-
Not predictive alone: Needs confirmation from other tools (MACD, RSI, volume).
-
No fixed rules: Different traders interpret levels differently.
-
Doesn’t show sequence: The order of price events isn’t shown between levels.
Closing Thoughts
Fibonacci retracement is a powerful and versatile technical analysis tool. While it may not provide guaranteed predictions, its ability to highlight key areas of interest gives traders a strategic edge.
Used correctly and in combination with other indicators, Fibonacci retracement can help traders make better decisions and manage risk more effectively.