


Introduction
Getting started with trading can feel overwhelming, especially when you’re met with complex charts. Some new traders follow their intuition, making decisions based on gut feelings. While that may work in a bull market, it’s rarely sustainable.
To succeed in trading and investing, you need a foundation in probability and risk management. One essential tool is the candlestick chart. In this article, we’ll break down what candlestick charts are, how they work, and how to read them effectively.
What Is a Candlestick Chart?
A candlestick chart is a type of financial chart used to represent the price movement of an asset over a specific period. Each “candlestick” shows the price data for a single period, whether it’s one minute, one hour, or even one day.
Candlestick charts have been around since the 17th century, first developed by Japanese rice traders. The modern version we use today builds on those early ideas, refined by figures like Charles Dow.
Although they can be used in other industries, candlestick charts are mainly used in financial markets to evaluate trends, reversals, and price behavior.
How Do Candlestick Charts Work?
To build each candlestick, four data points are needed:
Open: The price when the period begins.
High: The highest price reached during the period.
Low: The lowest price reached during the period.
Close: The price when the period ends.
These are commonly known as the OHLC values.
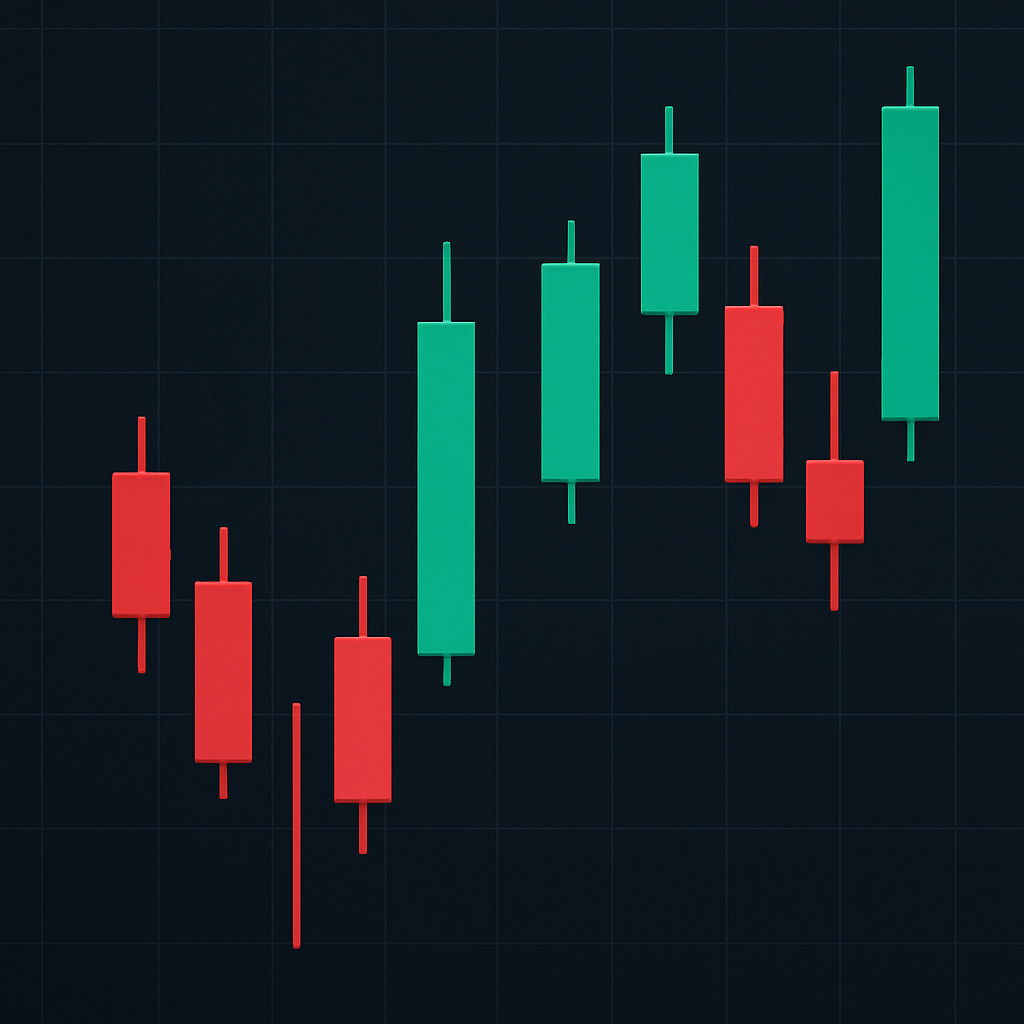
Anatomy of a Candlestick
Body: The area between the open and closed
Wick (or shadow): The line stretching from the body to the high or low.
Range: The full span from the high to the low of the candle.
The appearance of the candle depends on the relationship between the open and closed. For example:
A green (or hollow) candle means the price closed higher than it opened.
A red (or filled) candle means the price closed lower than it opened.
How to Read Candlestick Charts
Many traders find candlestick charts more intuitive than line or bar charts. They offer a quick, visual way to interpret price movement.
Each candlestick represents a battle between buyers and sellers:
A long body indicates strong buying or selling pressure.
Short wicks mean that prices stayed close to the open or close.
Charting software may use different color schemes. Some traders prefer black-and-white setups where rising candles are hollow and falling candles are filled.
What Candlesticks Don’t Tell You
While useful, candlestick charts don’t show every detail:
They don’t reveal the sequence of price movement (whether high or low came first).
They don’t show price activity between the open and close.
Candlestick Noise
Shorter timeframes introduce more “noise” – quick, erratic price moves that can mislead traders. These candles form and disappear quickly, making them harder to analyze reliably.
That’s why many traders prefer to confirm candlestick patterns using other indicators or on longer timeframes.
Heikin-Ashi Candlesticks
Heikin-Ashi is an alternative charting method that uses average price data to smooth out volatility.
Green Heikin-Ashi candles with no lower wicks may signal strong uptrends.
Red candles with no upper wicks could indicate strong downtrends.
This technique helps filter noise and highlight trends, but it comes with trade-offs. Because Heikin-Ashi uses average prices, it can hide gaps or delay signals compared to standard candlesticks.
Closing Thoughts
Candlestick charts are an essential part of any trader’s toolkit. They help visualize price behavior and guide decision-making in the markets.
Mastering these charts takes time, but it’s a worthy investment. Combine candlestick analysis with other methods like fundamental analysis or volume indicators for a more complete picture.
By practicing regularly and sharpening your pattern recognition skills, you can build a reliable edge in the crypto markets.
Start slow. Learn the patterns. Practice wisely.